Factcheck: Discrepancies In Nigeria Police’s Stolen, Recovered Vehicles Data
The National Bureau of Statistics could not satisfactorily explain the figures and directed HumAngle to the police, which has yet to react.

The latest figures from the Nigerian government regarding the number of vehicles stolen and then recovered by law enforcement officers are hard to reconcile.
The National Bureau of Statistics (NBS), Nigeria’s apex statistical agency, had included these figures in its Social Statistics in Nigeria report of 2020, citing the police headquarters as its source. It’s the fourth time the bureau would be releasing this report, following similar publications in 2012, 2016, and 2017. It explains that the project is borne out of the “need for credible and timely socio-economic data in Nigeria”.
Some of the information in the report is, however, puzzling.
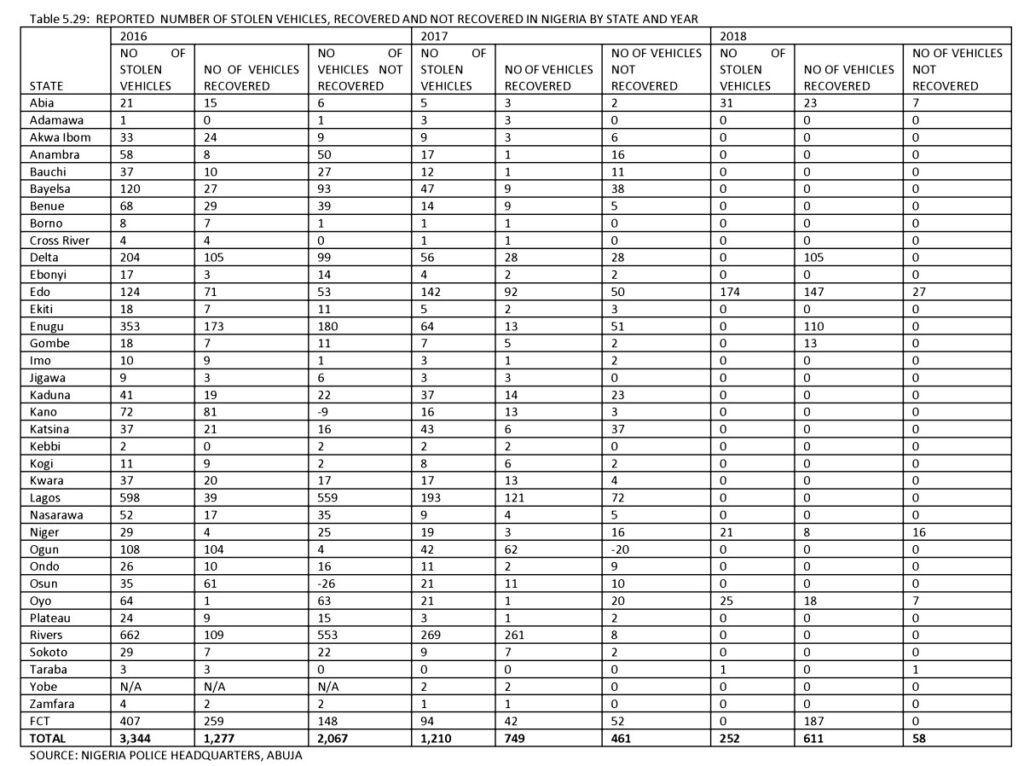
Page 237 contains a table stating the reported number of stolen vehicles, those recovered, and those not recovered across different states in the country between 2016 and 2018. But in at least eight instances, the number of vehicles recovered exceeded the number of those reported to have been stolen.
For example, the police claimed that in Kano in 2016, 72 vehicles were reported stolen, but its officers recovered 81, and so concluding that the number of vehicles not recovered was ‘minus nine’. The same year, it reported that 35 vehicles were recorded as stolen in Osun State. But as many as 61 were recovered.
In the following years, a similar trend was observed in figures from Delta, Enugu, Gombe, Niger, Ogun, and the FCT. In 2018, four states did not record any stolen vehicles but the law enforcement officers allegedly recovered between 13 and 187. There was also an arithmetic error recorded for Niger where 21 vehicles were reportedly stolen and eight reportedly recovered. Instead of 13, 16 vehicles were categorised as yet to be recovered in the state.

The “zero” reported for stolen vehicles in the four states in 2018 should not be confused with “not available”, since “N/A” was written elsewhere in the table for Yobe State in 2016 for all three categories. This means the figure can only be interpreted to mean no vehicles were reported to have been stolen that year in those states.
Also, it may be argued that there are more cases of recoveries compared to the number of stolen vehicles in some states because of yet-to-recovered vehicles carried over from the previous year. This explanation, however, does not hold up upon a closer look at the figures.
In Delta, in 2018, when over a hundred vehicles were recovered and none stolen, there were only 28 vehicles from the previous year’s theft cases that had not been recovered. When 187 vehicles were said to have been recovered in the Federal Capital Territory (FCT) that year and none stolen, there had only been 52 unresolved cases from the previous year. Similarly, in 2016 only four vehicles were stated as not recovered out of the 108 missing in Ogun State. But the following year, 20 more vehicles than were stolen were retrieved by the officers.

There are other parts of the table that raise eyebrows as well.
One, as many as 32 police commands, including that of the FCT, stated that no vehicles were stolen in 2018. Among them, 28 noted that no vehicles were recovered. The only exceptions were Abia, Edo, Niger, Oyo, and Taraba.
The dearth of data for 2018 from the police headquarters is also reflected in subsequent tables showing the numbers of rape incidents and persons reported missing over the three year period. While no rape incident was recorded for that year across the country, only Abia, Niger, Oyo, and Taraba recorded figures for missing persons. Statistics for the rest of the country were noted as “not available”.
It is also unusual that Lagos, Nigeria’s most populated state, had fewer cases of vehicle theft than places like Rivers between 2016 and 2017 and the majority of the states in 2018.
The NBS estimated that by mid-2018, there were 11.8 million vehicles in the country. Though it did not give a state-by-state breakdown, 25 per cent of drivers’ licences issued in the second quarter of that year were produced in Lagos, followed by the FCT with 11.5 per cent, and then Oyo with 6.3 per cent.
When HumAngle reached out to the statistical agency, it explained that the figures were secondary data which it had not generated itself but had only received from the police.
NBS Statistical Information Officer Moses Mathew further said the discrepancies could be because some of the vehicles stolen in one year were recovered the following year.
When HumAngle pointed out that some of the figures were still outrageous even when the number of unrecovered vehicles from the previous year was considered, he replied that “you must have a good time series to justify that.”
However, he added, the police should be contacted for clarification.
John Amadi, Acting Deputy Inspector-General at the force headquarters’ Department of Research and Planning, which is in charge of collecting and analysing statistics from various police commands, asked us to reach out instead to the spokesperson, Olumuyiwa Adejobi.
But Adejobi said he had not seen a copy of the document. Days after it was shared with him, he has yet to respond to HumAngle’s enquiries despite multiple reminders.
Support Our Journalism
There are millions of ordinary people affected by conflict in Africa whose stories are missing in the mainstream media. HumAngle is determined to tell those challenging and under-reported stories, hoping that the people impacted by these conflicts will find the safety and security they deserve.
To ensure that we continue to provide public service coverage, we have a small favour to ask you. We want you to be part of our journalistic endeavour by contributing a token to us.
Your donation will further promote a robust, free, and independent media.
Donate HereStay Closer To The Stories That Matter


